

Does Sampling Location Matter More Than Sampling Frequency in Dairy Quality Control?
Every dairy plant that has survived a serious product contamination event can produce a sampling log that looks airtight. Samples are carefully collected on schedule during every shift, and tests are diligently logged and filed. Nonetheless, an offending organism turns up in finished product before anyone in the plant can ferret it out. The instinct afterward is almost always to sample more often and run more tests. The harder question, and the one worth asking before adding a single sample to the schedule, is whether samples are being collected from the right locations in the first place.
In dairy processing, sampling location often matters more than sampling frequency because a well-placed sample is more likely to detect contamination close to its source before it becomes diluted downstream.
Schedules are Comforting
Structured sampling schedules are popular for good reasons. They are easy to defend to an auditor, easy to staff, and easy to turn into a chart that shows compliance. However, sampling against a schedule, by itself, says nothing about risk. A site that has tested contamination-free every week for three years produces a long, reassuring string of negatives, but that string does not ensure that a contamination issue will not crop up tomorrow. Sampling a genuinely high-risk harborage niche, however, can identify a potential product failure long before a pattern appears in downstream data. Strings of negative data do not provide assurance against future contamination. So, while frequency measures effort, it does not measure whether the effort is directed at the right target.
Where Does Post-Pasteurization Contamination Actually Come From?
Dairy contamination events do not occur “somewhere in the plant.” They originate from identifiable pieces of equipment, even if the sources are hard to find, and contamination may be transient. In 1920, a U.S. Department of Agriculture (USDA) milk inspector warned plants not to “rest assured of a safe product because of the mere presence of a milk pasteurizing plant,” specifically highlighting pumps, bottling machines, bottles, and milk cans as areas requiring close monitoring (Smith, 1920, as cited in Martin et al., 2018).
A century later, we have refined the sampling locations, but the principle remains the same. Post-pasteurization contamination is still a persistent challenge for dairy processors. Fillers are consistently identified as a primary source of persistent post-pasteurization contamination in fluid milk (Martin et al., 2018), but they are not the only source. Cousin’s (1982) review of dairy equipment surveys found that rubber parts on milking equipment harbored 10 to 117 times more bacteria than adjacent metal parts, and valves were consistently flagged as contributors. Contamination may concentrate in cracked seals, worn gaskets, and valve bodies. Further, Zottola and Smith (1985) showed that cracked or pitted heat exchanger plates can contribute to post-pasteurization contamination, and the same logic applies to silo doors and double-walled tanks or vats designed to facilitate heating or cooling. These are sampling locations where ports must be installed.
Bacteria are not evenly distributed across these sampling locations. Once a biofilm is established in one of those niches, it does not behave like an evenly mixed contaminant. Most biofilms shed cells intermittently and in relatively low numbers, not continuously or in bulk. Pioneering studies have established that once a dairy biofilm reaches its “steady-state” thickness, its detachment rate equals its net growth rate (Bremer et al., 2009). In locations that support only small biofilm growth, such as a crack in a gasket, low-level contamination can become a persistent challenge. These observations have a direct consequence for sampling: a port close to where a biofilm is prone to form is more likely to capture one of those low-volume shedding events. A port further downstream, where that same release has had time to disperse into a much larger volume of product, requires greater sampling frequency to improve the odds of catching the contaminant. Often, it still will not.
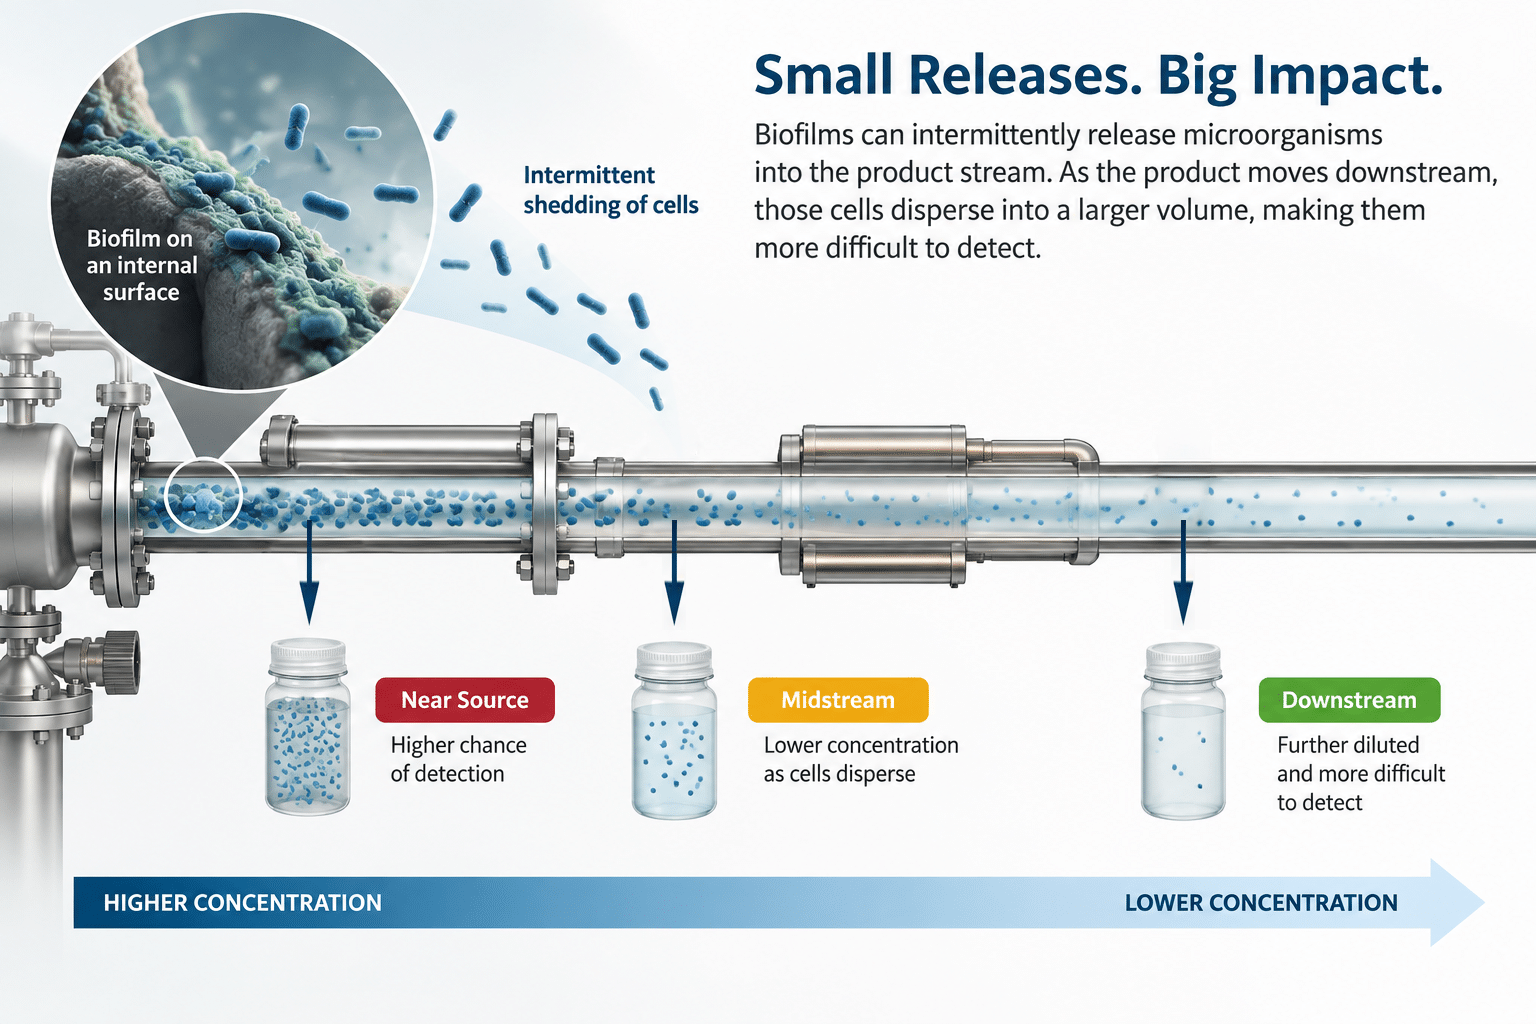
Keep in mind that even minimal contamination can affect milk quality. Milk is generally considered organoleptically spoiled at about 1,000,000 spoilage organisms per milliliter (106). Because psychrotrophic contaminants commonly double every 10 to 15 hours under refrigeration, a single organism in a liter of finished product will cross the spoilage threshold in roughly two weeks of refrigerated storage. That is one organism per liter, not per milliliter, so a sample taken in the wrong location downstream of the source is likely to miss the contaminant entirely. A plan must be in place to detect contamination at that minimal scale. No amount of added sampling frequency at the wrong spot in the process closes that gap.
Where Should You Sample in the Process?
From pasteurizers and holding tanks to valve clusters and fillers, sampling locations can shape the quality of the data you collect. See how aseptic inline sampling supports representative process monitoring at critical points throughout dairy production.
How Does Risk-Based Sampling Guide Port Placement?
Put those two factors together — contamination that starts small and disperses in small doses, and organisms that concentrate in a handful of physical locations — and the case for where to place a sampling port largely makes itself. A port placed for pipe-run convenience samples whatever passes, with no regard for the defects that actually harbor contamination. A port sited near a heat exchanger outlet, downstream of a valve body, or close to a gasket seam or weld, identified through a risk assessment of the line, however, collects samples near where contamination is most likely to originate. Once those locations are identified, aseptic sampling can help collect representative samples without introducing outside contamination that could compromise the result.
This presents the case for risk-based sampling. Location and frequency are sequenced; they are not competing variables. Identify where contamination is likely to enter or persist based on the physical realities of the process, and place sampling ports accordingly. Then let testing results over time determine how often each port needs to be checked. A high-risk port warrants more frequent sampling, while a low-risk one warrants less. Location is key, with sampling frequency calibrated to what each location indicates. That is a very different approach from a frequency-first design that hopes sampling lands in the right spots.
This same reasoning makes sampling more efficient, not just more likely to catch a problem. A sample taken downstream of a contamination source must contend with dilution before a contaminant is even detectable, so it takes several samples to detect what a single sample near the source would catch. The same number of tests delivers more statistical power when samples are taken close to a higher-risk location. This is the goal of representative, in-process sampling: collecting samples where they provide the most meaningful information about process conditions and contamination risk.
Similarly, a well-placed sample is more diagnostic. A positive result next to a specific gasket seam or valve body points directly to what needs attention, whereas a positive result from a generic downstream location only confirms that something upstream went wrong. More strategic sampling means fewer samples to reach the same confidence level and more information from each sample.
Turn Sampling Data Into Better Process Decisions
A strong sampling program does much more than generate test results. QualiTru’s Technical Services Educational Training (TSET) program provides teams with the tools to evaluate how sampling location, frequency, and process risk work together to support troubleshooting and proactive monitoring.
A Schedule Is Not a Strategy
A sampling calendar that looks rigorous on paper can still leave a plant blind if it prioritizes timing over location. The plants that get the most from their process sampling programs treat sampling location as the primary decision, based on where contamination physically enters and concentrates, and treat frequency as the variable they tune afterward, not the other way around. They sample where contamination can take hold, then let the test results tell them how often.
Could Your Sampling Plan Be Missing the Right Locations?
A sampling schedule can look thorough and still leave gaps if samples are collected too far from likely contamination sources. Contact us at (651) 501-2337 or email [email protected] to review your sampling locations, port placement, and process-monitoring strategies with our team.
References:

Bremer, P., Seale, B., Flint, S., & Palmer, J. (2009). Biofilms in dairy processing. In P. M. Fratamico, B. A. Annous, & N. W. Gunther IV (Eds.), Biofilms in the food and beverage industries (pp. 396–431). Woodhead Publishing. https://www.sciencedirect.com/book/edited-volume/9781845694777/biofilms-in-the-food-and-beverage-industries

Cousin, M. A. (1982). Presence and activity of psychrotrophic microorganisms in milk and dairy products: A review. Journal of Food Protection, 45(2), 172-207.

Martin, N. H., Boor, K. J., & Wiedmann, M. (2018). Symposium review: Effect of post-pasteurization contamination on fluid milk quality. Journal of Dairy Science, 101(1), 861-870. https://www.journalofdairyscience.org/article/S0022-0302(17)30968-2/fulltext

Zottola, E. A., Smith, L. B. (1985). Survival of Salmonellae in Refrigerated, Agitated Water and Water/Glycol Mixtures. Journal of Food Protection, 49(6), 467-470. https://www.sciencedirect.com/science/article/pii/S0362028X23000819?via%3Dihub