
Within Spec Doesn’t Mean Under Control: Why Process Monitoring Matters
A dairy plant can run for months with every microbiological test result within limits and still be heading toward a failure. Finished product tests pass, specifications are met, and everything looks good. Then a customer reports early spoilage and a review of the records reveals something uncomfortable. The warning was simmering in the data for weeks. Every individual result passed, but the results as a group had been trending the wrong way. That is where process monitoring becomes critical.
The gap is between meeting a specification and having a process under control. Only process monitoring can show which side of that gap a plant is on. The two sound alike, but they are not. They ask and answer different questions. A plant that treats them as one will tend to learn about its problems later, often too late.
Two Questions, Not One
A specification asks whether a specific lot of product met a specified limit on the day it was tested. That is essentially a pass-or-fail question. Process control asks something else: Is the process producing stable, predictable results, and are those results staying where they have been, getting better, or trending worse? Answering those questions requires process monitoring: the routine collection, review, and trending of data across various stages of the process, not just from finished-product testing.
Microbiological specifications come from several sources. Regulatory limits, such as the standard plate count and coliform limits for pasteurized Grade A milk in the Pasteurized Milk Ordinance (U.S. Food and Drug Administration [FDA], 2026), exist to protect public health and the marketplace. Plants set their own internal specifications, often tied to shelf life targets. Individual customers may also impose quality standards that are tighter than regulatory limits or cover organisms not covered by either regulation or the plant’s internal controls. None of these specifications describe how a particular process is performing.
That distinction is easy to miss because a single-day result can mean very different things. A result that is well below a specification limit may indicate a stable process or one drifting out of control. Recognizing trends over time, rather than isolated results, is key to understanding process stability and averting failures.
A Passing Result Is a Snapshot
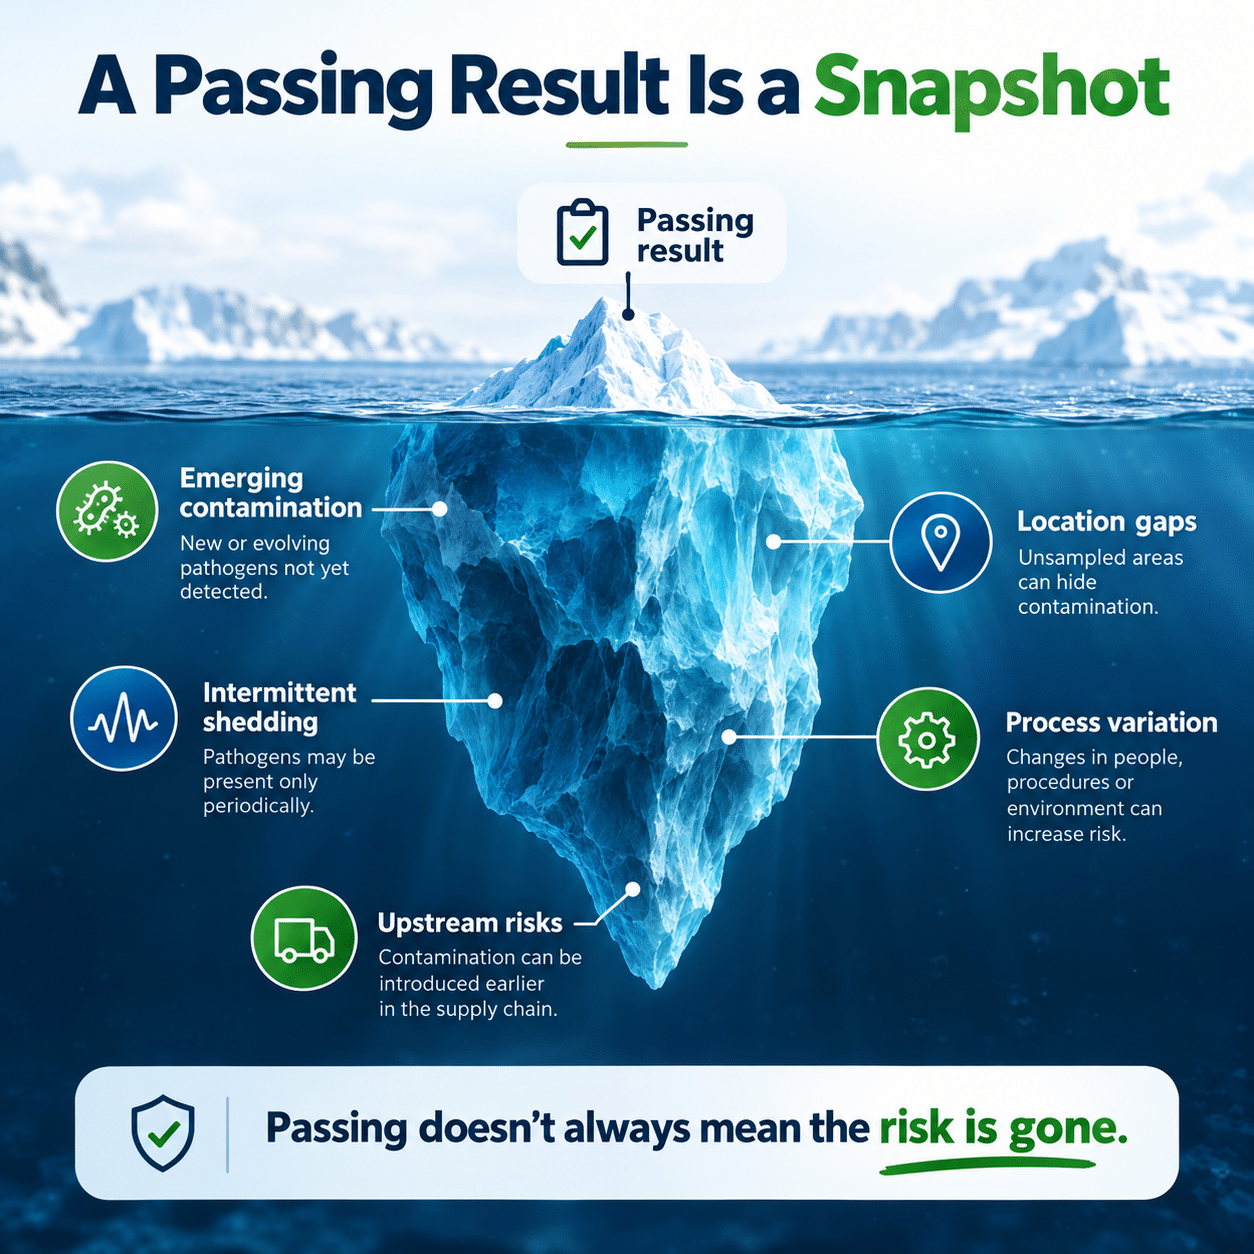
A finished product sample is a small portion of a large product volume, tested at a single point in time. A passing result indicates that the organisms in that portion were below the limit at the time of testing. It does not tell us how many organisms entered the product at levels below detection limits, where they entered, or what the product will look like after days of refrigerated storage. Finished product testing monitors the outcome, while process monitoring watches the conditions that produce it.
This matters most for contamination that enters after pasteurization. Martin et al. (2018) reviewed how post-pasteurization contamination affects fluid milk quality. Psychrotrophic organisms introduced after the heat step are often present in very low numbers at packaging but can multiply during cold storage, shortening shelf life (Cousin, 1982). Products can be fully within specification at packaging because contaminating organisms are too few to detect, yet still fail within the stated shelf life. In that situation, the passing result is accurate but not reassuring.
What a Trend Shows That a Result Does Not
Consider a plant that has tested its finished product and in-process samples for years and has come to expect a certain range of results. Over several days or weeks, results begin to run higher than the usual range, and then higher again. Some organisms move from not detected to detected. None of them are anywhere near the specification limit, so nothing triggers a response. Finished product tests may stay within specification the whole time, because contamination at that level is too low to detect in the finished product. However, recognizing this trend early can help you avoid spoilage and maintain quality.
Nothing in that scenario required new data. The information was already in the plant’s records. What was missing was a consistent trend analysis across the process. That means comparing results with the plant’s own history at each step of production, not just with the finished product limit.
A process under control produces results that fluctuate around a stable level. Results always vary from day to day, so a single higher reading within the specification doesn’t raise an eyebrow. A steady climb, a run of readings all on the high side of normal, or the presence of an organism that does not belong are different. It suggests that something in the process has changed:
- a worn gasket
- a cracked seal
- a pinhole leak in a heat exchanger plate
- a compromised membrane or filtration step
- a sanitation step that is no longer effective
- a change in incoming raw material, new or modified equipment
- an adjustment to the clean-in-place program
- or any number of other variables
The trend does not identify which variable, but it does say it is time to find out while the answer is still inexpensive.
What the Organism and Location Add
Counts are only part of the picture. What was found and where often says more than how much.
Organisms that do not survive pasteurization should not be present afterward. When psychrotrophic Gram-negative bacteria appear in the product after the heat-treatment step, the explanation is almost always downstream contamination, not a pasteurization failure (Martin et al., 2018). The question is, from where? Spore-forming organisms raise a different question because they can survive heat treatment. A sporeformer recovered downstream of a plate heat exchanger, even at a count well within specification, may indicate a biofilm or hygiene problem in the heat-treatment equipment itself and warrants investigation (Bremer et al., 2009).
Membrane filtration raises a comparable question. For example, reverse osmosis membranes used in whey processing can develop bacterial biofilms that persist despite routine cleaning (Anand et al., 2014). In a membrane process, a shift in microbial counts or organism types downstream of the membrane compared with upstream, particularly one that persists after cleaning, can point to a developing membrane problem and show where to investigate next.
These patterns become visible only when the process is monitored at points between the raw milk and the finished package, not just at the end.
When Finished Product Testing Isn’t Enough
See how strategic in-process sampling helped a dairy plant trace persistent ice cream mix contamination through the process and focused corrective action where it was needed.
Process Monitoring and Trend Analysis: Reading Results Against the Plant’s Own History
Plants that manage and monitor their processes carefully tend to ask a few key questions about their data.
- Are this month’s results in the same range as last month’s?
- Are we seeing the same mix of organisms?
- Are anomalies becoming more frequent or appearing at points where they did not before?
- Did anything change in the equipment, sanitation, or incoming materials around the time the pattern began?
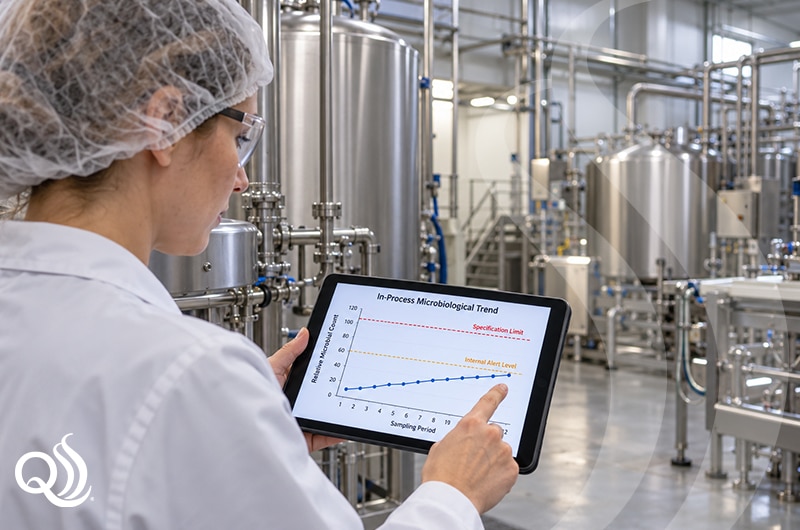
They also set internal alert levels separate from the finished product specification, so changes in the data trigger a response while there is still time to find a solution. The specification is the point at which the product is rejected. An internal alert level is the point at which someone gets curious and begins a root cause analysis.
Want to See How In-Process Sampling Supports Process Monitoring?
Aseptic inline sampling helps quality teams collect representative samples at critical process points, trend results over time, and investigate where contamination may enter the process.
Staying Inside the Specification
Meeting the specification shows that a specific lot of product was acceptable on the day it was tested. It met both internal and external specifications and was released for shipment. This type of finished product testing will always be part of dairy quality assurance. However, it is a result, not an explanation. Whether the process will continue to produce acceptable lots depends on whether the plant is watching the direction its data is moving, not only on whether the latest result passed.
The bigger question, therefore, is not whether the product meets specification but whether the process is behaving as expected. Process monitoring is how a plant finds out.
Not Sure What Your Process Data Is Telling You?
If your results are technically within spec but trending in the wrong direction, our team can help you think through sampling locations, monitoring strategy, and next steps for investigation. Complete our Ask the Experts form, call (651) 501-2337, or email [email protected] and a QualiTru account representative will connect with you.
References:

Anand, S., Singh, D., Avadhanula, M., & Marka, S. (2014). Development and control of bacterial biofilms on dairy processing membranes. Comprehensive Reviews in Food Science and Food Safety, 13(1), 18-33. https://doi.org/10.1111/1541-4337.12048

Bremer, P., Seale, B., Flint, S., & Palmer, J. (2009). Biofilms in dairy processing. In P. M. Fratamico, B. A. Annous, & N. W. Gunther IV (Eds.), Biofilms in the food and beverage industries (pp. 396-431). Woodhead Publishing. https://doi.org/10.1533/9781845697167.4.396

Cousin, M. A. (1982). Presence and activity of psychrotrophic microorganisms in milk and dairy products: A review. Journal of Food Protection, 45(2), 172-207. https://doi.org/10.4315/0362-028X-45.2.172

Martin, N. H., Boor, K. J., & Wiedmann, M. (2018). Symposium review: Effect of post-pasteurization contamination on fluid milk quality. Journal of Dairy Science, 101(1), 861-870. https://www.journalofdairyscience.org/article/S0022-0302(17)30968-2/fulltext

U.S. Food and Drug Administration. (2026). Grade “A” pasteurized milk ordinance: 2025 revision. U.S. Department of Health and Human Services, Public Health Service. https://www.fda.gov/media/193438/download